
predicting fraud using financial statements
Posted on May 6, 2024
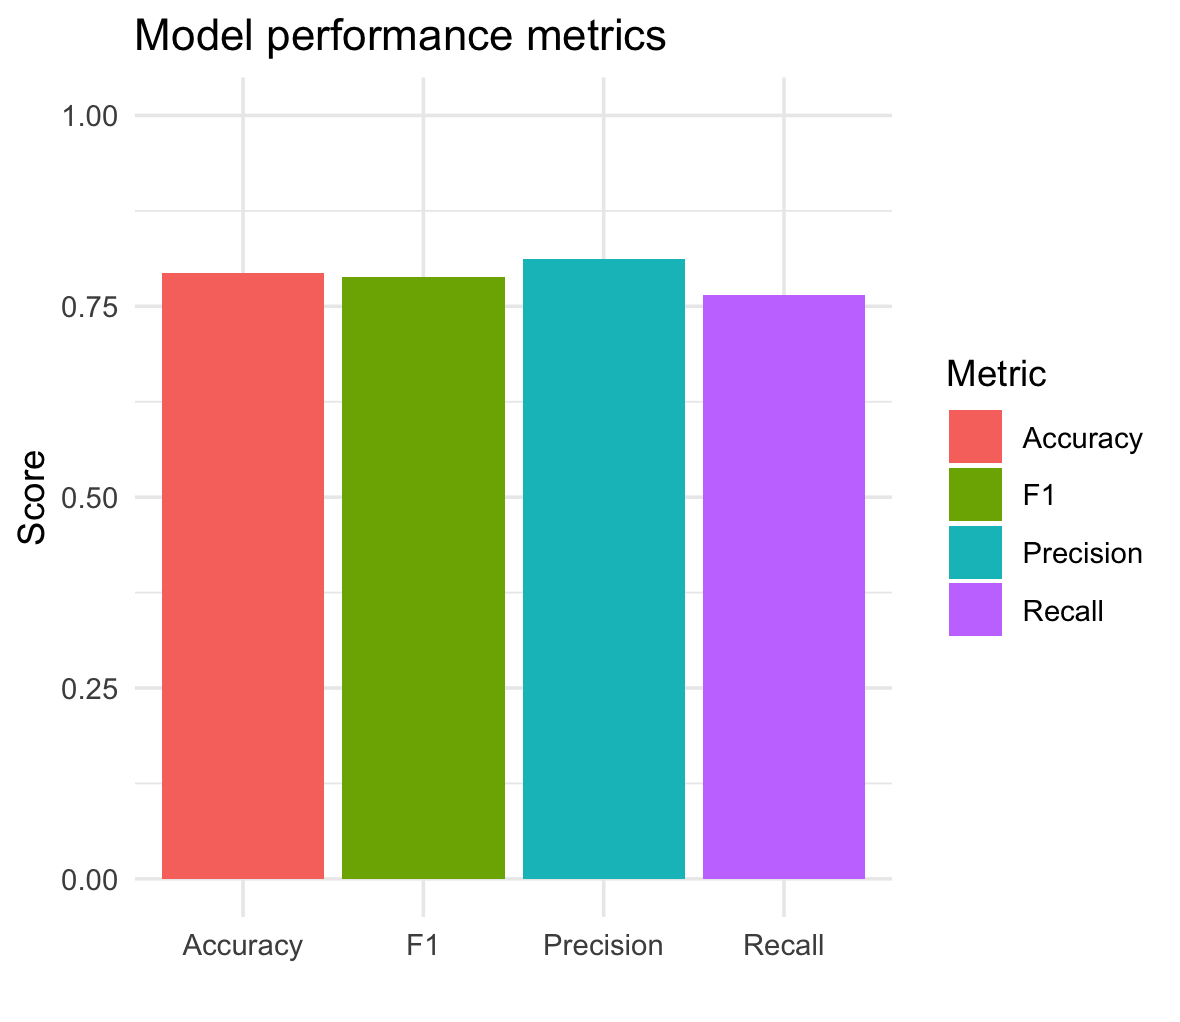
Discovered a dataset on Kaggle with financial filings from 170 companies, half fradulent the other not. I built an NLP model in R that processes the text from the “Fillings” column using vectorization to capture the key textual features and applies logistic regression for classification into fraudulent/not fraudulent. Accuracy 79% (50-50 balanced dataset). Not terrible for a baseline model.
Something I will return to in the future, maybe.
| Metric | Value |
|---|---|
| Accuracy | 0.7941176 |
| Precision | 0.8125000 |
| Recall | 0.7647059 |
| F1 | 0.7878788 |
library(tm)
library(caret)
library(ggplot2)

set.seed(123)  # for reproducibility

data <- https://www.kaggle.com/datasets/amitkedia/financial-statement-fraud-data?resource=download

data$Fraud <- as.factor(data$Fraud)

corpus <- Corpus(VectorSource(data$Fillings))

# Preprocess and create a Term-Document Matrix with TF-IDF weighting
corpus <- tm_map(corpus, content_transformer(tolower))
corpus <- tm_map(corpus, removePunctuation)
corpus <- tm_map(corpus, removeNumbers)
corpus <- tm_map(corpus, removeWords, stopwords("english"))
corpus <- tm_map(corpus, stripWhitespace)
tdm <- TermDocumentMatrix(corpus, control = list(weighting = weightTfIdf))

x <- as.matrix(tdm)
x <- t(x)

y <- data$Fraud

trainIndex <- createDataPartition(y, p = .8, list = FALSE, times = 1)
trainX <- x[trainIndex, , drop = FALSE]
trainY <- y[trainIndex]
testX <- x[-trainIndex, , drop = FALSE]
testY <- y[-trainIndex]

model <- train(trainX, trainY, method = 'glmnet', trControl = trainControl(method = "cv", number = 10))

predictions <- predict(model, testX)

predictions <- factor(predictions, levels = levels(testY))
testY <- factor(testY, levels = levels(predictions))

confMatrix <- confusionMatrix(predictions, testY)

accuracy <- confMatrix$overall['Accuracy']
precision <- confMatrix$byClass['Precision']
recall <- confMatrix$byClass['Recall']
f1 <- confMatrix$byClass['F1']

performance_data <- data.frame(
  Metric = c("Accuracy", "Precision", "Recall", "F1"),
  Value = c(accuracy, precision, recall, f1)

ggplot(performance_data, aes(x = Metric, y = Value, fill = Metric)) +
  geom_bar(stat = "identity", position = position_dodge()) +
  ylim(0, 1) +
  labs(title = "Model performance metrics", y = "Score", x = "") +
  theme_minimal()